Green logistics means cutting the emissions from moving and storing goods, and you can’t cut what you haven’t measured. If you’re deciding where to start, begin with one shared way of counting.
| Item | Value |
|---|---|
| Share of global CO2 emissions from freight and logistics | Around 8-10% |
| Multinationals that have formally adopted the GLEC Framework | More than 30 since its first release in 2016 |
| Year the Global Logistics Emissions Council (GLEC) began its work | 2014 |
| Transport modes covered by the GLEC method | Road, rail, air, sea, inland waterways and transhipment centers |
| Date of the GHG Protocol blog post on the framework | 30 October 2019 |
The figures come from Shell Foundation’s 9 July 2019 news item and the GHG Protocol blog post. Figures like these can change, so check the source before you rely on them.
What does green logistics cover?
Green logistics is the work of lowering the environmental impact of getting goods from supplier to customer, and sometimes back again. It touches vehicles, buildings, packaging flows and the data used to run them. If you want the broader idea first, read about what is sustainability and then return here.
It helps to split the topic into areas that each have their own levers:
- Transport: which mode carries the goods, which vehicles, and which routes.
- Sites: warehouses, depots and transhipment centers.
- Final delivery: the short, often frequent trips to the customer’s door.
- Returns: goods flowing back for resale, repair or recycling.
- Reporting: the numbers that show whether any of it worked.
The sections below take these in turn. Treat the list as a map rather than a checklist, because the right starting point depends on where your own emissions sit.
Why measurement comes first
Until the GLEC Framework appeared, GHG Protocol described comparing emissions across transport modes as comparing apples to oranges, because so many methodologies existed. The GHG Protocol blog post says the Smart Freight Centre released the framework as a guide for shippers, carriers and logistics service providers. It is meant to be used together with the Corporate Standard and has earned the “Built on GHG Protocol” mark.
According to the same post, GLEC is a group of companies, associations and programs led by Smart Freight Centre, and its members include DHL, SNCF, Maersk, TNT, Hapag-Lloyd and Kuehne + Nagel. Since its inception in 2014, it has developed a universal method for calculating logistics emissions across road, rail, air, sea, inland waterways and transhipment centers.
A common method matters because the numbers then drive decisions. The post says companies can use emissions data to select more fuel efficient modes, routes and carriers, and to find ways to increase efficiency and reduce costs. It also says the framework is designed to increase transparency, giving companies with smaller footprints a competitive advantage.
The Shell Foundation’s 9 July 2019 item describes the updated framework as designed to be easy to implement, with clear calculation steps, guidance on reporting and target setting. It adds that more than 30 leading multinationals have formally adopted the framework since its first release in 2016.
Where freight emissions sit
The same Shell Foundation item says freight and logistics are reckoned to generate around 8-10% of global CO2 emissions (source). Treat that as a rough order of magnitude from a 2019 source, not a precise or current measurement.
The framework is built to calculate and report emissions from planes, trains, ships, trucks and logistics sites consistently across supply chains, per the Shell Foundation. That wide scope is useful, because the biggest source of emissions in your network may not be the one you assume. A side-by-side look at shipping emissions by transport mode is a good way to see how the choice between road, rail, air and sea changes the picture.
Buildings and handling points count too. The GHG Protocol post names transhipment centers within the method, and our guide to sustainable warehousing looks at the storage side of the chain.
Levers that reduce emissions in transport
Once you have a baseline, the practical levers fall into a few groups. The GHG Protocol post points to modes, routes and carriers as the choices that data can inform. Each lever below links to a deeper guide.
- Routes: shorter, smoother trips are a core idea behind route optimization reduce emissions planning.
- Load building: combining orders into fewer trips is the idea behind consolidated shipping.
- Vehicles: switching the fleet is covered in the guide to electric delivery vehicles.
- Final stretch: the short trips to customers are the focus of last mile delivery emissions.
These levers interact. A fuller truck on a better route using a cleaner vehicle compounds the gains, but you only know by how much if your accounting method stays the same before and after.
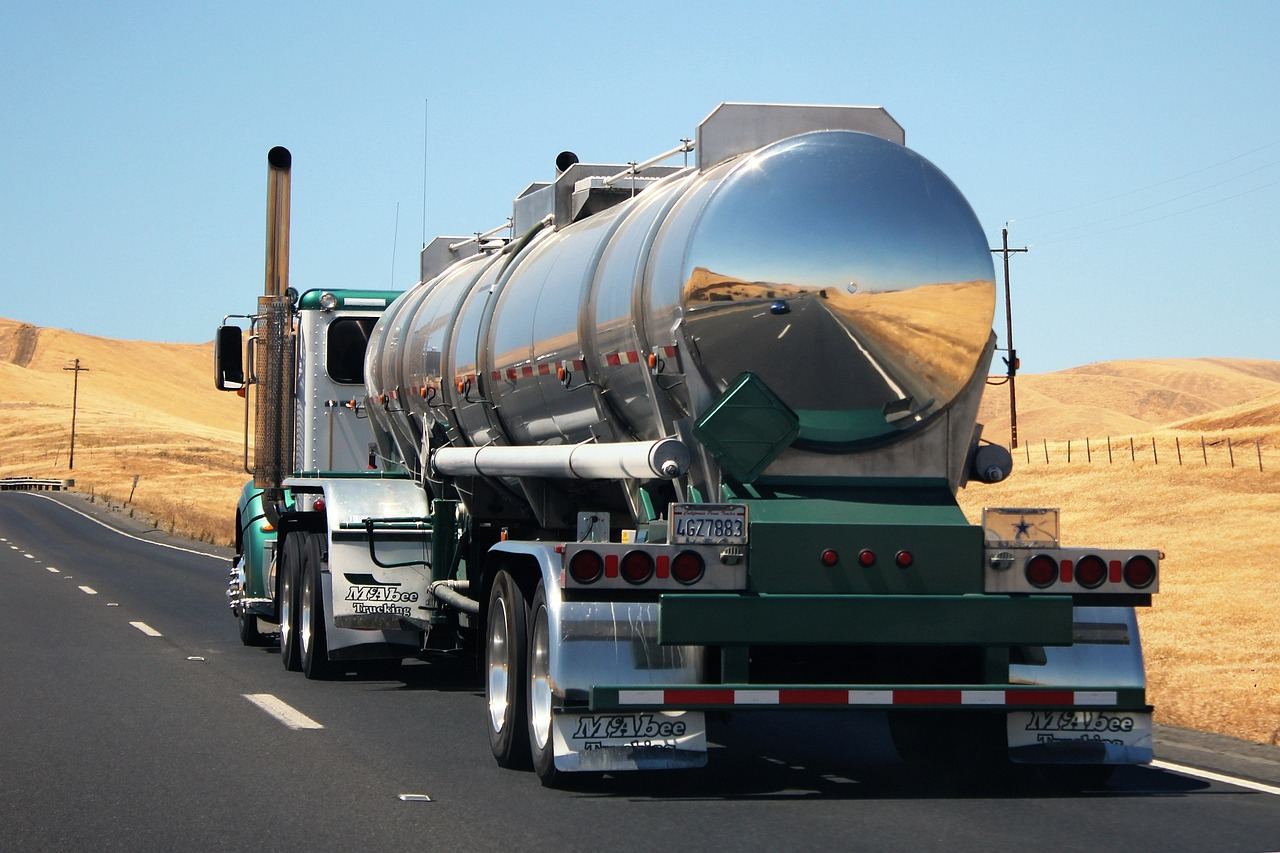
Keep your baseline method fixed while you test changes. If you switch calculation methods midway, you can’t tell a real improvement from a change in how you counted.
Returns, offsets and online retail
Goods that travel back are part of the footprint too. The guide to reverse logistics explains how returns, repair and recycling flows fit into the supply chain.
Many shippers also look at offsetting. The guide to carbon neutral shipping explains what that label can and cannot tell you, and the key point is that offsets sit alongside direct reductions, not in place of measuring them.
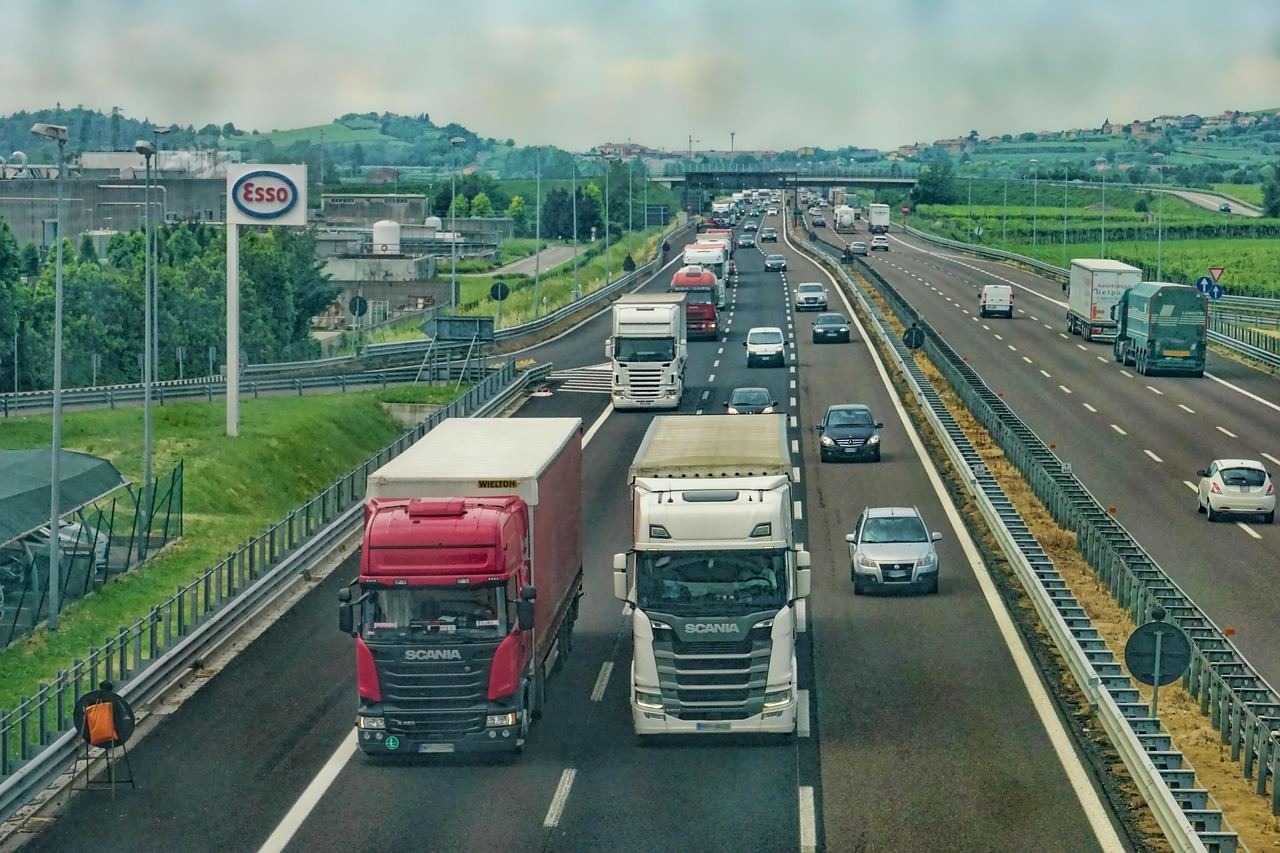
If you sell online, delivery and returns are a large share of what customers see of your supply chain. The overview of sustainable ecommerce shows how logistics choices connect to the rest of an online business.
A practical order of work
You don’t need to do everything at once. A sensible order is to measure, then target, then change:
- Pick one accounting method, such as the GLEC Framework, which is designed to work with the GHG Protocol Corporate Standard.
- Map your freight by mode, carrier and site, so you can see where the emissions sit.
- Calculate a baseline using the method’s calculation steps.
- Set a target using the framework’s guidance on reporting and target setting, as described by the Shell Foundation.
- Change one lever at a time, such as routes or load building, and recalculate with the same method.
The GHG Protocol post also notes that GLEC plans to keep filling gaps and to expand the framework with Black Carbon and air pollutants. Check the latest version of the framework before you build a reporting process around it, since the post dates from 30 October 2019.
Frequently asked questions
What is green logistics?
Show answer
It is the practice of reducing the emissions and wider environmental impact of moving, storing and returning goods. A good first step is to measure your freight emissions with an established method.
How much of global CO2 comes from freight?
Show answer
The Shell Foundation’s 9 July 2019 news item says freight and logistics are reckoned to generate around 8-10% of global CO2 emissions. Estimates vary by source and year, so check for newer figures.
What is the GLEC Framework?
Show answer
It is a method for calculating logistics emissions across road, rail, air, sea, inland waterways and transhipment centers. The GHG Protocol blog post from October 2019 says it is meant to be used alongside the Corporate Standard.
Who has adopted the framework?
Show answer
As of the Shell Foundation’s July 2019 item, more than 30 leading multinationals had formally adopted it since its first release in 2016. That count is from 2019, so the current number may differ (source).